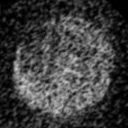
In the received spectrograms, the Moon's face appears to lie on it's side, with the left-to-right time axis (6 s/pix) during the fan-beam passage approximately oriented south to north. The most favourable transits appear when the moon reaches its most northern declination (28.5°), then the elevation at the transmitter site is higher (more signal), and the passage is more parallel to he fan beam plane, resulting in longer total duration (up to 7 minutes) and higher Doppler resolution.
The Doppler axis (set to 0.042 Hz/pix) is west ("left" on moon, higher frequency) to east (lower frequency). The total spread is about 3 Hz from edge to edge, mostly caused by the diurnal variation of the aspect angle (libration) due to Earth's rotation. The receiver is locked to an OCXO, providing better than 0.1 ppb stability. To preserve the possible time-Doppler resolution, the overall chirp has to be removed at least approximately by applying a quadratic phase term (-0.0165 Hz/s) before doing the Fourier transforms.
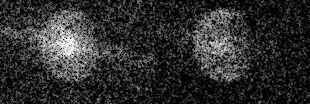
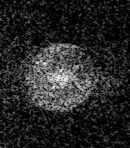
The spectrograms are shown in pairs, with vertical polarization in the left and horizontal in the right half. By evaluating the signal correlation between the two receiver channels and subtracting any possible noise correlation, the polarization state of the specular reflection was derived. It is shown here as the spatial orientation of the major axis (+-atan(|H/V|), 0° vertical, +-90° horizontal) and the circularity (derived from the phase shift between H and V, 0° linear, +-90° circular polarized). Purely co- and crosspolarized signals were then synthesized, using linear combinations with maximum- and minimum-signal weighting respectively. Despite its much lower overall SNR, the crosspolarized component produced definitely nicer images, lacking the bright central glare caused by specular reflection. Presumably due to ionospheric Faraday rotation and changing electron contents, the received polarisation state varied from day to day in an unpredictable way.
Using IrfanView, the geometrical distortion of the images was corrected heuristically by remapping in four steps:
1. resize to 100x100 pixels ellipse width and height (=> large axis at 45°),
2. rotate left by 45° (=> ellipse upright),
3. resize to 100x100 pixels (=> circle),
4. rotate left by 30°...60° (=> north up).
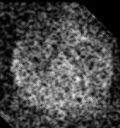
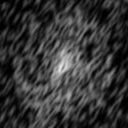
The resulting crosspolarized image is shown as the rightmost picture for each day of observation.

2006 Jan 20, 04:54 UT, elevation at TX 0°, moonrise at Lake Kickapoo!


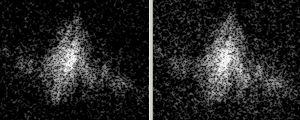
2006 Jan 19, 04:50 UT, el. 10°, polarization orientation 8.9°, circularity -19.2°

2006 Jan 18, 04:46 UT, el. 20°, pol. -53.2°, cir. -19.7° - frequency stability problem?
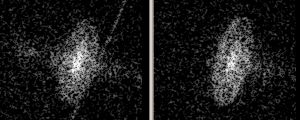

2006 Jan 17, 04:40 UT, el. 30°, pol. 37.7°, cir. 51.8°

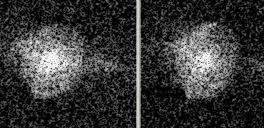
2006 Jan 16, 04:33 UT el. 40°, pol. 42.9°, cir. 41.7°
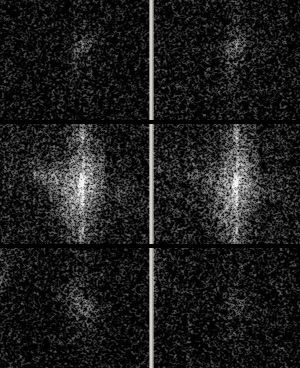
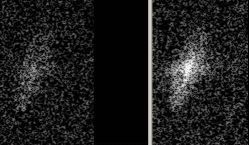
Top: Gila River (el. 28°,+49 Hz), center: Lake Kickapoo (40°,+20 Hz), bottom: Jordan Lake (50°,-15 Hz).
All three transmitters (216.97, .98 and .99 MHz) were received simultaneously, using frequency modulation to create local oscillator sidebands at +-10.0 kHz, with signals separated only by their different Doppler shifts. The sensitivity per channel is thus reduced by 6 dB. The vertical streak was caused by a modulation glitch.


2006 Jan 15, 04:21 UT, el. 48°, no polarization result due to interference

2006 Jan 14, 04:02 UT, el. 56°, pol. 35.7°, cir. -7.3°


2006 Jan 13, 03:29 UT, el. 60°, pol. 61.1°, cir. -17.6°


2006 Jan 12, 02:37 UT, el. 61°, pol. 48.5°, cir. -5.1°

2006 Jan 11, 01:23 UT, el. 56°, pol. 30.7°, cir. -29.1°

2006 Jan 09, 23:57 UT, el. 48°, pol. 18°, cir. -42.7°
2005 Oct 29, 10:18 UT, el. 8°, pol. 66.7°, cir. -30.8° (?)


2006 Oct 28, 10:14, el. 19°, pol. 60.9, cir. 31.4°


2006 Oct 26, 10:02 UT, el. 39°, pol. 81.5°, cir. -51.2°


2006 Oct 23, 09:05 UT, el. 60°, pol. -10.8°, cir. 68.0°

2006 Oct 22, 08:16 UT, el. 61°, pol. 0.9°, cir. 16.8°

2006 Oct 21, 07:04 UT, el. 57° (only horizontal polarization measured)
- Higher resolution spectrograms (21 mHz) are here
- back to main page.